Performance profiling is essential for game development and real-time applications.
While powerful tools like Tracy or VTune can do the job very well, they often come with unnecessary complexity, integration annoyances, or platform-specific limitations.
What if you just need a dead simple, lightweight, minimal-overhead hierarchical profiler that seamlessly integrates with Dear ImGui? That’s exactly what I built for my CppCon 2025 keynote demo, and this article will explore its design and implementation.
background
Last month, I delivered my first ever keynote at CppCon 2025: “More Speed & Simplicity: Practical Data-Oriented Design in C++”. I am very thankful for the opportunity, and proud of the result – the topic is dear to me, and the talk has been well-received so far.
As part of the keynote, I created an interactive demo using my fork of SFML where millions of entities are simulated using different memory layouts.
Inspired by a tweet1, I decided to create a dead simple hierarchical profiler that I could use to visually check the performance of the simulation.
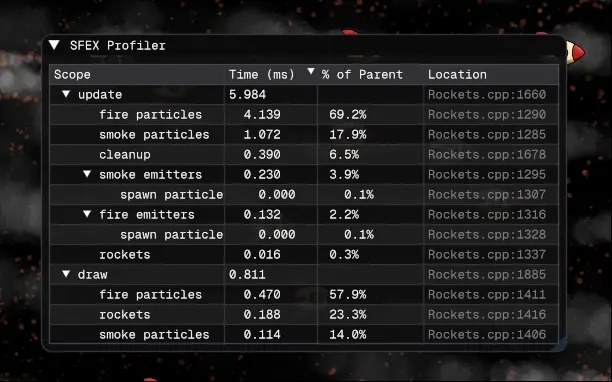
One GIF WebP is worth a thousand words!
design goals
Before diving into the code, let’s establish what we’re trying to achieve:
Small runtime cost: Only add negligible overhead to the measured code.
Scope-based hierarchical timing: Track parent-child relationships between scoped regions.
Thread-local and thread-safe: Each thread maintains its own profiling data.
ImGui integration: Visualize profiling data in a sortable tree view with minimal effort.
Fast to compile: Minimal standard library usage, no expensive template shenanigans.
Focus on simplicity: We are not aiming to dethrone VTune or to profile a multi-threaded AAA game engine. 😁
The API will be as straightforward as possible:
void update()
{
    SFEX_PROFILE_SCOPE("update");

    {
        SFEX_PROFILE_SCOPE("fire particles");

        for (Particle& p : fireParticles)
            updateParticle(p);
    }

    {
        SFEX_PROFILE_SCOPE("smoke emitters");

        for (auto& e : smokeEmitters)
            updateEmitter(e, [&] { /* ... */ });
    }

    // ...
}
That’s it. No manual start/stop calls, no explicit tree building, no cleanup code.
core data structures
The profiler’s foundation is “flat” and simple. First, we need to store information about each profiled scope:
struct ScopeInfo
{
    std::string_view label;
    std::string_view file;
    std::string_view func;

    int line;

    std::int64_t timeUs;

    std::size_t nodeId;
    std::size_t parentNodeId;

    std::size_t depth;
};
Each ScopeInfo captures everything we need to know about
a profiled region: its label (user-provided), source location (captured
automatically), measured time in microseconds, hierarchical
relationships, and nesting depth.
The profiler maintains a fixed-size array of these nodes:
struct Database
{
    static constexpr std::size_t maxNodes = 512;

    ScopeInfo nodes[maxNodes]{};

    std::size_t nextNodeId    = 0;
    std::size_t currentNodeId = nullNode;
    std::size_t currentDepth  = 0;
};

inline thread_local Database tlDatabase;
The thread_local here ensures that each thread has its
own independent profiling database, eliminating any need for
synchronization primitives that would add overhead.
A fixed-size array was chosen for simplicity and to avoid
allocations, but it could easily be replaced with a
std::vector.
thread_local scope
information
Attaching metadata to each profiled scope is done by introducing a
static thread_local variable as part of the
SFEX_PROFILE_SCOPE macro expansion. This allows each scope
to initialize its metadata once per thread, then reuse that
metadata on every subsequent invocation:
#define SFEX_PROFILE_SCOPE(label)          \
                                           \
    static thread_local auto& scopeInfo =  \
        tlDatabase.initNode((label),       \
            __FILE__, __func__, __LINE__); \
                                           \
    const ScopeGuard scopeGuard(scopeInfo)
During the first invocation, the scopeInfo
reference is initialized by calling initNode, which grabs a
free slot in the fixed-size array and fills in the scope’s metadata.
On every subsequent invocation, the
thread_local reference already exists, so initialization is
skipped – we simply reuse the existing ScopeInfo
object.
This pattern is quite efficient: there’s no allocation, no hash table lookup, no string comparison. The only small overhead is a guard check to ensure that the variable is initialized exactly once, but it is easily predictable – check out the assembly if you’re curious.
RAII-based timing
The ScopeGuard class handles the actual timing and tree
management:
struct ScopeGuard
{
    ScopeInfo&  scopeInfo;
    TimePoint   startTime;
    std::size_t previousNodeId;

    explicit ScopeGuard(ScopeInfo& info) :
        scopeInfo{info},
        startTime{sf::Clock::now()},
        previousNodeId{tlDatabase.currentNodeId}
    {
        auto& db = tlDatabase;

        scopeInfo.parentNodeId = db.currentNodeId;
        db.currentNodeId       = scopeInfo.nodeId;
        db.currentDepth        = scopeInfo.depth + 1;
    }

    ~ScopeGuard()
    {
        auto& db = tlDatabase;

        scopeInfo.timeUs =
            (sf::Clock::now() - startTime).asMicroseconds();

        db.currentNodeId = previousNodeId;
        db.currentDepth  = scopeInfo.depth;
    }
};
The constructor reads the clock and updates the profiler’s state to reflect that we’ve entered a new scope. The destructor reads the clock again to compute the elapsed time, then restores the previous state.
The parent-child relationship is established by setting
scopeInfo.parentNodeId to whatever
db.currentNodeId was pointing at. This naturally builds a
hierarchical tree structure as scopes nest within each other.
Note that there is some overhead associated with the clock that depends on its platform-specific implementation – if the work being measured is very small, it could end up being significant. The intended usage pattern for this profile is to measure the entirety of a hot loop, i.e.:
{
    SFEX_PROFILE_SCOPE("fire particles");

    for (Particle& p : fireParticles)
        updateParticle(p);
}
Not:
for (Particle& p : fireParticles)
{
    SFEX_PROFILE_SCOPE("fire particle iteration");
    updateParticle(p);
}
So, it shouldn’t matter in practice.
building the tree
The profiler stores scope information in a flat array, which is simple and cache-friendly. However, to render a tree view in ImGui, we need to reconstruct the hierarchical relationships.
This is done on-demand every frame, reusing some pre-allocated vectors:
void populateNodes(
    std::span<const ScopeInfo>             scopeInfos,
    std::vector<std::vector<std::size_t>>& childrenMap,
    std::vector<std::size_t>&              rootNodes)
{
    childrenMap.resize(maxNodes);

    for (auto& vec : childrenMap)
        vec.clear();

    rootNodes.clear();

    for (const auto& info : scopeInfos)
    {
        if (info.timeUs == nullTime) // `nullTime` is just `-1`
            continue;

        if (info.parentNodeId == nullNode)
            rootNodes.push_back(info.nodeId);
        else
            childrenMap[info.parentNodeId].push_back(info.nodeId);
    }
}
The algorithm is straightforward:
- Clear the previous frame’s data.
- Iterate through all scope information.
- If a scope has no parent, it’s a root node.
- Otherwise, add it to its parent’s children list.
The timeUs == nullTime check filters out scopes that
haven’t been executed in the current frame (initialized but unused).
smoothing with circular buffers
Raw timing measurements are generally too noisy/jittery. To make the profiler output more readable, I smooth the measurements using a fixed-capacity circular buffer:
class Sampler
{
    std::vector<float> m_data;
    const std::size_t  m_capacity;

    std::size_t m_size  = 0;
    std::size_t m_index = 0;

    float m_sum = 0.f;

public:
    explicit Sampler(std::size_t capacity) :
        m_data(capacity, 0.f),
        m_capacity(capacity)
    {
    }

    void record(float value)
    {
        if (m_size < m_capacity) // filling phase
        {
            m_data[m_index] = value;
            m_sum += value;
            ++m_size;
        }
        else // full capacity, let's loop around!
        {
            m_sum = m_sum - m_data[m_index] + value;
            m_data[m_index] = value;
        }

        m_index = (m_index + 1) % m_capacity;
    }

    double getAverage() const
    {
        return m_size == 0
            ? 0.0
            : static_cast<double>(m_sum) / m_size;
    }
};
Instead of recalculating the average from scratch on every
getAverage call, I maintain a running sum and update it
incrementally.
imgui integration
The ImGui rendering is where all the pieces come together. Here’s a simplified version of the tree rendering logic:
void renderNode(
    const std::vector<Sampler>&             timeSamplers,    // one per node
    const std::vector<Sampler>&             percentSamplers, // one per node
    std::size_t                             nodeId,
    std::span<const ScopeInfo>              allNodes,
    const std::vector<std::vector<size_t>>& childrenMap)
{
    const auto& info     = allNodes[nodeId];
    const auto& children = childrenMap[nodeId];

    ImGui::TableNextRow();
    ImGui::TableSetColumnIndex(0); // label

    ImGuiTreeNodeFlags nodeFlags = ImGuiTreeNodeFlags_SpanAvailWidth |
                                   ImGuiTreeNodeFlags_DefaultOpen;

    if (children.empty())
    {
        // Leaf nodes don't need a collapsing arrow and don't push to the ID stack
        nodeFlags |= ImGuiTreeNodeFlags_Leaf | ImGuiTreeNodeFlags_NoTreePushOnOpen;
    }

    // We use the node's ID as a unique identifier for ImGui
    const bool isNodeOpen = ImGui::TreeNodeEx(
        reinterpret_cast<void*>(nodeId), nodeFlags, "%s", info.label.data());

    ImGui::TableSetColumnIndex(1); // time (ms)
    ImGui::Text("%.3f", timeSamplers[nodeId].getAverage());

    ImGui::TableSetColumnIndex(2); // % of parent
    if (info.parentNodeId != nullNode)
        ImGui::Text("%.1f%%", percentSamplers[nodeId].getAverage());

    ImGui::TableSetColumnIndex(3); // source location
    ImGui::Text("%s:%d", extractFilename(info.file).data(), info.line);

    // Recurse into children if the node is open and has children
    if (isNodeOpen && !children.empty())
    {
        for (const auto childId : children)
            renderNode(timeSamplers, percentSamplers, childId, allNodes, childrenMap);

        ImGui::TreePop(); // Only needed if the node was not a leaf
    }
}
The function recursively renders each node and its children. ImGui’s table API handles column layout, and the tree node API provides the collapsible hierarchy.
The node ID is used as ImGui’s internal ID (via a terrible
reinterpret_cast<void*>(nodeId)) – this ensures each
node in the tree is uniquely identifiable even if labels might be
duplicated.
sortable columns
One of the nicest features is the ability to sort the tree by any column. This is mainly achieved with a custom comparator lambda:
if (ImGuiTableSortSpecs* specs = ImGui::TableGetSortSpecs())
{
    const auto nodeComparer = [&](std::size_t a, std::size_t b) -> bool
    {
        const auto& infoA = scopeInfos[a];
        const auto& infoB = scopeInfos[b];

        for (int i = 0; i < specs->SpecsCount; ++i)
        {
            const auto* sortSpec = &specs->Specs[i];
            int delta = 0;

            if (sortSpec->ColumnUserID == 0) // label
            {
                delta = infoA.label.compare(infoB.label);
            }
            else if (sortSpec->ColumnUserID == 1) // time (ms)
            {
                delta = compareFloats(timeSamplers[a].getAverage(),
                                      timeSamplers[b].getAverage());
            }
            else if (sortSpec->ColumnUserID == 2) // % of parent
            {
                delta = compareFloats(percentSamplers[a].getAverage(),
                                      percentSamplers[b].getAverage());
            }
            else if (sortSpec->ColumnUserID == 3) // location
            {
                delta = infoA.file.compare(infoB.file);

                if (delta == 0)
                    delta = infoA.line - infoB.line;
            }

            if (delta != 0)
                return (sortSpec->SortDirection == ImGuiSortDirection_Ascending)
                        ? (delta < 0) : (delta > 0);
        }

        return false;
    };

    std::sort(rootNodes.begin(), rootNodes.end(), nodeComparer);

    for (auto& vec : childrenMap)
        std::sort(vec.begin(), vec.end(), nodeComparer);
}
ImGui’s table sorting API provides specifications for which column(s)
to sort by and in which direction via TableGetSortSpecs –
this basically tells us what the user wants.
The custom comparator is then used to sort both the root nodes and each parent’s children list.
limitations and trade-offs
While the profiler works great for its intended use case, it has some limitations:
Fixed node count: This could be easily relaxed by using a
std::vectoror configured via macro or template parameter.No recursion handling: If a function recursively calls itself, each recursion level creates a separate node. Detecting recursion would lead to much nicer results.
Single-threaded visualization: Each thread has its own profiling data. The ImGui view only shows data for the thread that calls
showImguiProfiler. Cross-thread aggregation would require additional complexity.Only the average is captured: The
Samplerclass could be extended to also capture min/max times, detect “spikes”, and generally provide more metrics.
These trade-offs keep the implementation simple and still very valuable in many common development scenarios.
conclusion
Sometimes, the simplest solutions can be very effective, even if they come with significant limitations.
This is clearly not a production-ready™ profiler you’d ship
in a release build, but it’s a great lightweight development tool.
Whenever I start a new ImGui-based project, I can just include a header
and sprinkle a few SFEX_PROFILE_SCOPE macros as needed, and
I’ll have an interactive and visually appealing way of keeping
performance under scrutiny.
The complete implementation weighs in at under 500 lines of code (including ImGui integration), proving that you don’t need thousands of lines to build something genuinely useful. You can find the relevant files here:
If you’re working on a game or real-time application with Dear ImGui, I encourage you to try out this profiling approach. You might be surprised at how much insight you gain from such a small addition to your codebase!
Of course, it’s not a replacement for mature tools such as VTune or Tracy, and it doesn’t perform potentially important tasks such as GPU profiling. Yet, it might be good enough for your project, or an easy-to-use stepping stone until something more powerful is needed.
Feel free to steal borrow any of the code above. I am
using my own Standard Library implemention as I am obsessed by fast
compilation times2, but it should be trivial to convert
it to the good old std.
shameless self-promotion
I offer training, mentoring, and consulting services. If you are interested, check out romeo.training, alternatively you can reach out at
mail (at) vittorioromeo (dot) comor on Twitter.Check out my newly-released idle/clicker game on Steam: BubbleByte – it’s only $3.99 and one of those games that you can either play actively as a timewaster or more passively to keep you company in the background while you do something else.
My book “Embracing Modern C++ Safely” is available from all major resellers.
- For more information, read this interview: “Why 4 Bloomberg engineers wrote another C++ book”
If you enjoy fast-paced open-source arcade games with user-created content, check out Open Hexagon, my VRSFML-powered game available on Steam and on itch.io.
- Open Hexagon is a community-driven spiritual successor to Terry Cavanagh’s critically acclaimed Super Hexagon.